Troubleshooting Analytics.js
To help you troubleshoot common issues when implementing Analytics.js, this page covers steps to verify your implementation, resolve errors, and ensure that data correctly flows to your destinations.
You can manually execute any Analytics.js methods. Use the Network tab to inspect requests. Learn how to access the JavaScript console in each browser.
Are you loading Analytics.js?
Open the JavaScript console and enter analytics. If it returns an object, as shown below, then you’re successfully loading Analytics.js onto your website.
If you get an undefined error, Analytics.js is not loading successfully:
Segment also provides a Chrome web extension, Segment Inspector, which you can use to validate that you’re successfully loading Analytics.js.
To learn more, follow the Analytics.js Quickstart Guide.
Loading multiple instances of Analytics.js
Analytics.js snippet loaded more than once
You cannot load the Analytics.js snippet twice on the same page, even if different write keys are used. Doing so might result in errors like Uncaught RangeError: Maximum call stack size exceeded.
However, you can conditionally set the write key based on an environment variable:
Example:
var writeKey;
ENV === 'production' ? writeKey = 'A' : writeKey = 'B';
Multiple Versions of Analytics.js
You can load multiple versions of Analytics.js in the same environment. For example, you could have both a snippet version and an npm version on one page, each with different write keys. This allows the npm library and the browser snippet to coexist without conflicting.
Keep the following limitations in mind:
- Device-Mode Destination Conflicts: If you are using the same device-mode destination in both instances (for example, across different write keys), conflicts may occur. This is due to third-party scripts that don’t support global instances. To avoid issues, ensure you are not using the same device-mode destination with different write keys.
- CDN URL Customization: Segment does not support overriding the CDNURL when using multiple instances of Analytics.js.
How do I resolve the ‘Failed to Load Analytics.js ChunkLoadError’?
The error can occur for different reasons:
-
Snippet syntax: Ensure you correctly added the Segment snippet to the page. Check for any missing or extra characters. Follow this guide.
-
npm package: If you’re using Segment through npm, refer to this guide.
-
Browser cache: Clear the browser cache, as this is a common cause for
ChunkLoadError. -
Cloudflare caching: If you use Cloudflare to proxy Segment, disable caching for the Segment JS file.
Do you see events appear in your debugger?
When you reload the page, does your debugger show a new Page call? You can also check the JavaScript console in the browser and manually fire an event, like an Identify call, which would show up in the debugger.
- You can use Segment’s Chrome extension to inspect events.
If the call doesn’t appear in the debugger, open the JavaScript console and check the Network tab to see if the outbound web services requests are being initiated:
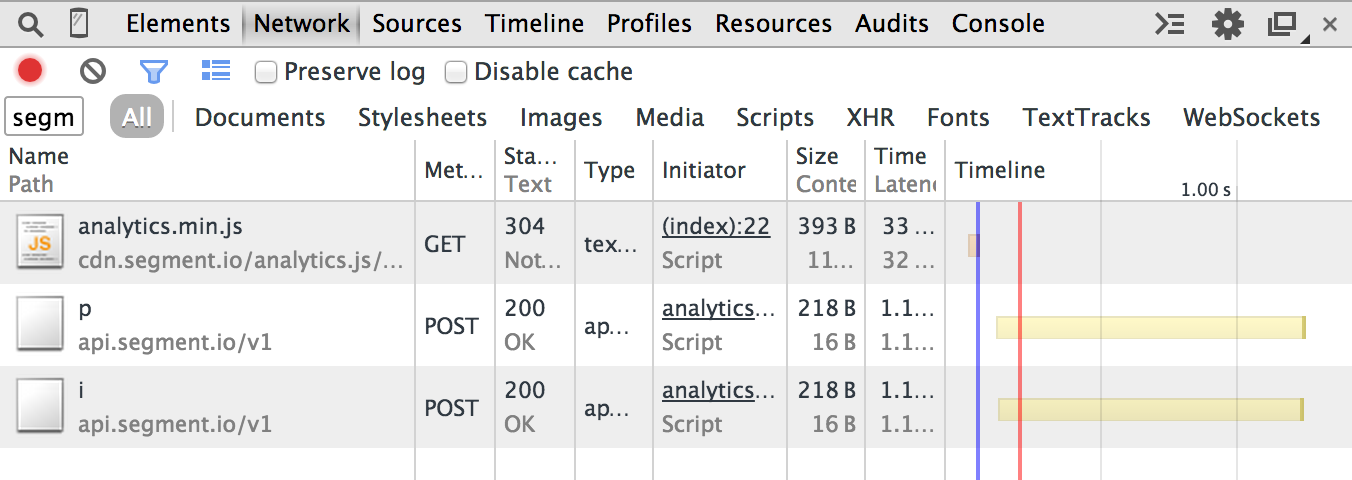
In the above, the p is a Page call and the i is an Identify call. If you don’t at least see the p, verify that you are loading Analytics.js correctly.
Using the Segment Chrome extension to validate your implementation
The Segment Inspector is a Chrome extension designed for debugging Segment integrations in web applications using Analytics.js. The Inspector lets you view and verify event data before it’s sent to destinations. Additionally, the tool confirms that API calls from your website reach your Analytics.js source correctly.
Is data being transmitted to your third-party destinations?
Some destinations send data directly from the website to their servers. You can check the Network tab in your JavaScript console to see the outbound web services requests being initiated.
Using Google Analytics as an example, the Page call forms an outbound request that looks like this:
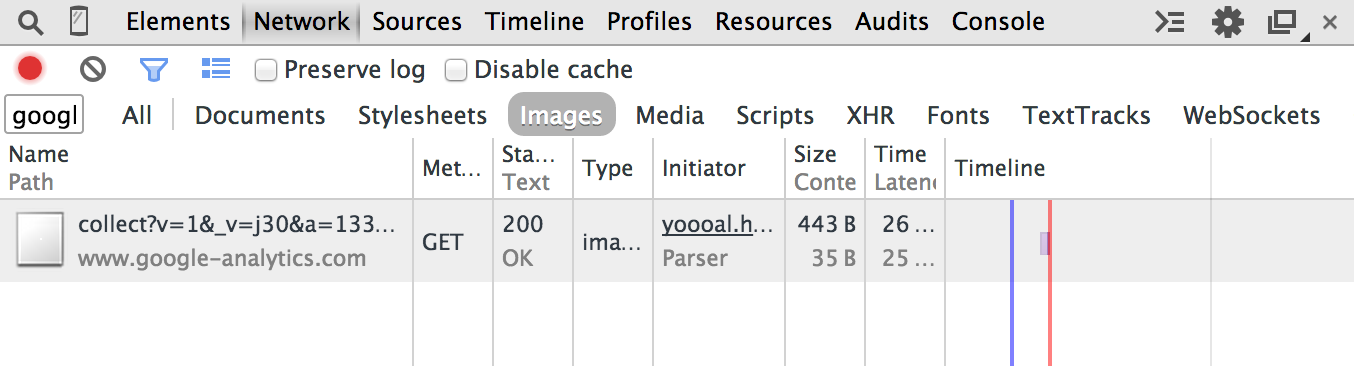
If this outbound request is not showing up in the network when you fire an Identify call, then view the following sections for more troubleshooting steps.
Is your website deployed under a domain on the Public Suffix List?
The Public Suffix List is a catalog of certain Internet effective top-level domains, enumerating all domain suffixes controlled by registrars.
The implications of these domain suffixes are that first party cookies cannot be set on them. Meaning, foo.example.co.uk can share cookie access with bar.example.co.uk, but example.co.uk should be walled off from cookies at example2.co.uk. The latter two domains could be registered by different owners.
Examples of domains on the Public Suffix List that are common in troubleshooting include:
*.github.io*.herokuapp.com*.appspot.com
How do I open the JavaScript console in your debugger?
The JavaScript console reveals all requests, outbound and inbound, to your browser. Additionally, you may execute valid JavaScript.
- Chrome:
COMMAND+OPTION+J(Mac) orCTRL+SHIFT+J(Windows). - Firefox:
COMMAND+OPTION+K(Mac) orCTRL+SHIFT+K(Windows) and then click on the Console tab. - Safari:
COMMAND+OPTION+I(Mac) orCTRL+ALT+I(Windows) and then click on the Console tab. - IE:
F12and then click on the Console tab.
Alternatively, Segment provides the Segment Inspector, a Chrome web extension designed to enable debugging of your Segment integration in web applications that are instrumented with Analytics.js.
Analytics.js failing to load due to ad blockers or browser privacy settings
Segment advises against circumventing tracking blockers or browser privacy settings for client-side tracking. The user has ultimate control as to what gets loaded on the page. Segment acknowledges that this can result in some data loss in client-side tracking and suggests workarounds to address this issue.
Analytics.js and destinations not tracking query string parameters on certain Safari iOS and macOS versions
Due to updates in certain Safari iOS and macOS versions, Segment’s Analytics.js and destinations tools might experience limitations in capturing query string parameters. As a result, you may notice some events missing campaign information.
Why am I seeing a “SameSite” warning?
If you see a warning like the following, it could have one of several causes:
“A cookie associated with a cross-site resource at http://segment.com/ was set without the SameSite attribute […]”
Segment correctly sets cookies with the SameSite attribute with Analytics.js.
If you see this warning, it’s because you previously visited http://segment.com, and are getting the warning due to unrelated cookies. To verify that this is the issue, visit your page in Incognito Mode and confirm that the warning no longer occurs. Your users won’t see this warning unless they also visited http://segment.com.
Why am I seeing additional cookies on my website?
The Analytics.js cookies being set under segment.com are first-party cookies. They are part of Segment’s own implementation as well as the destination Segment uses. These cookies are not related to your implementation of Segment, and you only see them because you’ve visited Segment’s domain using the same browser. They are sent to the writekey connected to Segment’s own workspace, and are associated with the events Segment tracks when you visit segment.com.
Known incompatibilities with Prototype.js
If you’re having issues with your destinations loading with Prototype.js, there is a known issue that was reported regarding this. In order to prevent the issue, you can preserve the original Array.from method without letting the prototype override it.
Why am I getting an empty campaign object in my event payload?
Analytics.js generates a campaign object inside the context object whenever the URL contains search parameters. Without any UTM parameters, the campaign object remains empty.
Why do I see events with timestamps in the past or future?
You may see events with timestamp discrepancies due to manual overriding of the timestamp value, mobile apps closed or set in the background, traffic from bots, or inaccurate device or browser time. For more information, see Segment’s Common Fields Spec.
View additional known issues
You can review other known Analytics.js issues on GitHub.
This page was last modified: 30 Jun 2025
Need support?
Questions? Problems? Need more info? Contact Segment Support for assistance!