Auto-Instrumentation Setup
This guide outlines the steps required to set up the Signals SDK in your JavaScript website.
Learn how to connect an existing source, integrate dependencies, turn on Auto-Instrumentation, and verify that your setup captures and processes data as intended.
Auto-Instrumentation in public beta
Auto-Instrumentation is in public beta, and Segment is actively working on this feature. Some functionality may change before it becomes generally available.
Regional availability
Auto-Instrumentation isn’t supported in EU workspaces.
Step 1: Get your source write key
You need the writeKey from an existing Segment source. To find it:
- In your Segment workspace, go to Connections > Sources.
- Select your source.
- From the source’s overview tab, go to Settings > API Keys.
- Copy the
writeKeyshown in the code block.
Step 2: Add dependencies and initialization code
Next, add the Signals SDKs to your web environment.
Choose the installation method that matches your setup:
- Option A: For websites loading Segment through the HTML snippet.
- Option B: For projects using npm, yarn, or pnpm.
Option A: Websites using the Segment snippet (HTML)
Include only one Segment snippet per page. Replacing your existing snippet prevents duplicate analytics.load() calls.
If your site uses the standard Segment snippet, replace it with the following version, which includes the Signals SDK:
<head>
  <title>My Website</title>
  <!-- Replace <YOUR_WRITE_KEY> in 'data-segment-write-key' -->
  <script data-segment-write-key="<YOUR_WRITE_KEY>">
    !(function () {
      var i = "analytics",
        analytics = (window[i] = window[i] || []);
      if (!analytics.initialize)
        if (analytics.invoked)
          window.console &&
            console.error &&
            console.error("Segment snippet included twice.");
        else {
          analytics.invoked = !0;
          analytics.methods = [
            "trackSubmit",
            "trackClick",
            "trackLink",
            "trackForm",
            "pageview",
            "identify",
            "reset",
            "group",
            "track",
            "ready",
            "alias",
            "debug",
            "page",
            "screen",
            "once",
            "off",
            "on",
            "addSourceMiddleware",
            "addIntegrationMiddleware",
            "setAnonymousId",
            "addDestinationMiddleware",
            "register",
          ];
          analytics.factory = function (e) {
            return function () {
              if (window[i].initialized)
                return window[i][e].apply(window[i], arguments);
              var n = Array.prototype.slice.call(arguments);
              if (
                [
                  "track",
                  "screen",
                  "alias",
                  "group",
                  "page",
                  "identify",
                ].indexOf(e) > -1
              ) {
                var c = document.querySelector("link[rel='canonical']");
                n.push({
                  __t: "bpc",
                  c: (c && c.getAttribute("href")) || void 0,
                  p: location.pathname,
                  u: location.href,
                  s: location.search,
                  t: document.title,
                  r: document.referrer,
                });
              }
              n.unshift(e);
              analytics.push(n);
              return analytics;
            };
          };
          for (var n = 0; n < analytics.methods.length; n++) {
            var key = analytics.methods[n];
            analytics[key] = analytics.factory(key);
          }
          analytics._writeKey = document.currentScript.getAttribute("data-segment-write-key");

          var r = document.getElementsByTagName("script")[0];
          analytics.load = function (key, n) {
            var t = document.createElement("script");
            t.type = "text/javascript";
            t.async = !0;
            t.setAttribute("data-global-segment-analytics-key", i);
            t.src =
              "https://cdn.segment.com/analytics.js/v1/" +
              key +
              "/analytics.min.js";
            r.parentNode.insertBefore(t, r);
            analytics._loadOptions = n;
          };

          analytics.loadWithSignals = function (key, n) {
            var signalsScript = document.createElement("script");
            signalsScript.type = "text/javascript";
            signalsScript.src =
              "https://cdn.jsdelivr.net/npm/@segment/analytics-signals@latest/dist/umd/analytics-signals.umd.js";
            signalsScript.async = !0;
            r.parentNode.insertBefore(signalsScript, r);
            signalsScript.onload = function () {
              var signalsPlugin = new SignalsPlugin();
              analytics.register(signalsPlugin);
              analytics.load(key, n)
            };
          };

          analytics.loadWithSignals(analytics._writeKey)
          analytics.page()
        }
    })();
  </script>
</head>
Verify that you only have one snippet in your site, then move on to Step 4: Verify and deploy events.
Option B: Install with a package manager
- Add the Signals SDK to your project:
# npm npm install @segment/analytics-signals # yarn yarn add @segment/analytics-signals # pnpm pnpm install @segment/analytics-signals - Add the initialization code and configuration options:
see configuration options for a complete list.
  // analytics.js/ts
  import { AnalyticsBrowser } from "@segment/analytics-next";
  import { SignalsPlugin } from "@segment/analytics-signals";

  export const analytics = new AnalyticsBrowser();

  const signalsPlugin = new SignalsPlugin();

  analytics.register(signalsPlugin);

  analytics.load({
    writeKey: "<YOUR_WRITE_KEY>",
  });
Verify that you replaced <YOUR_WRITE_KEY> with the actual write key you copied in Step 1.
- Build and run your app.
Step 3: Turn on Auto-Instrumentation in your source
Next, return to the source settings to turn on Auto-Instrumentation:
- Go to Connections > Sources.
- Select the source you used in Step 1.
- From the source’s overview tab, go to Settings > Analytics.js.
- Toggle Auto-Instrumention on.
Step 4: Verify and deploy events
After integrating the SDK and running your app, verify that Segment is collecting signals:
- In your Segment workspace, go to Connections > Sources and select the source you used for Auto-Instrumentation.
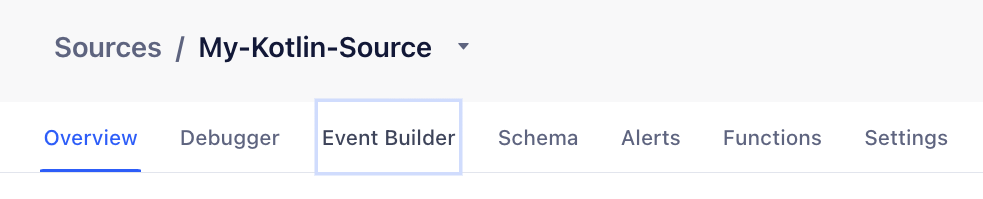
- In the source overview, look for the Event Builder tab. If the tab doesn’t appear:
- Make sure you’ve installed the SDK correctly.
- Verify that Auto Instrumentation is enabled in Settings > Analytics.js.
- Open the Event Builder and follow the on-screen instructions to start signal detection.
- To collect signals in the UI, visit your site in a browser using the query string:
?segment_signals_debug=true.
- To collect signals in the UI, visit your site in a browser using the query string:
- Interact with your app to trigger signals: click buttons, navigate pages, submit forms, and so on. Segment collects and displays these as signals in real time.
- From the signals list, click Configure event to define a new event based on one or more signals. After configuring the event, click Publish event rules.
Debugging
Enable debug mode
User activity is not collected by default after SDK installation. To collect activity for use in building event rules, append the segment_signals_debug=true URL parameter.
https://my-website.com?segment_signals_debug=true
Loading the site with this debug URL parameter stays active in session storage until the tab or window is closed. Within a session the URL parameter does not need to be present on each page load.
You can turn off debugging by doing:
https://my-website.com?segment_signals_debug=false
Advanced
Signal redaction and debug visibility
The Signals SDK automatically hides sensitive values in user interactions before sending them to Segment.
To protect user data, the SDK replaces real values with safe, generic placeholders: strings become "XXX", numbers become 999, and booleans become true.
Redaction applies to everything the SDK collects, including:
- Form submissions and text inputs
- Clickable elements and their text content
- Request bodies for tracked network calls
- Certain DOM attributes observed by mutation listeners
If you’re troubleshooting and want to see real values while debugging, you can disable redaction temporarily by adding this to your site URL:
?segment_signals_debug=true&segment_signals_disable_redaction=true
Use this only in a safe testing environment: disabling redaction can expose real user information (PII).
For persistent setups or automated testing, you can also control this behavior in code with:
new SignalsPlugin({ disableSignalRedaction: true })
For more information, see the configuration options table.
Emitting custom signals
If you need to listen for data that is unavailable to the Signals plugin by default, you can create and emit a custom signal:
var signalsPlugin = new SignalsPlugin(); // or use the global variable if you registered it globally
signalsPlugin.addSignal({ someData: 'foo' })


// emits a signal with the following shape
{
  type: 'userDefined'
  data: { someData: 'foo', ...  }
}
Listening to signals
const signalsPlugin = new SignalsPlugin();
signalsPlugin.onSignal((signal) => console.log(signal));
Middleware / Plugins
You can drop or modify signals using middleware:
import { SignalsPlugin, SignalsMiddleware } from "@segment/analytics-signals";

class MyMiddleware implements SignalsMiddleware {
  process(signal: Signal) {
    // drop all instrumentation signals
    if (signal.type === "instrumentation") {
      return null;
    } else {
      return signal;
    }
  }
}

const signalsPlugin = new SignalsPlugin({
  middleware: [new MyMiddleware()],
});
analytics.register(signalsPlugin);
Sandbox strategies
If you get CSP errors, you can use the experimental ‘global’ sandbox strategy:
new SignalsPlugin({ sandboxStrategy: "global" });
Configuration options
Using the Signals Configuration object, you can control the destination, frequency, and types of signals that Segment automatically tracks within your application. The following table details the configuration options for Signals Web.
Option |
Required | Value | Description |
|---|---|---|---|
maxBufferSize |
No | number | The number of signals to be kept for JavaScript inspection. This buffer is first-in, first-out. Default is 1000. |
enableDebugLogging |
No | boolean | Enable debug logs. |
disableSignalRedaction |
No | boolean | Disable default Signal data redaction. |
apiHost |
No | string | Override the default signals API host. Default is signals.segment.io/v1. |
functionHost |
No | string | Override the default edge host. Default is cdn.edgefn.segment.com |
flushAt |
No | number | How many signals to flush at once when sending to the signals API. Default is 5 . |
flushInterval |
No | number | How many ms to wait before flushing signals to the API. The default is 2000. |
middleware |
No | SignalsMiddleware[] | Array of middleware to process signals before they are sent. |
sandboxStrategy |
No | ‘global’ | ‘iframe’ | Sandbox strategy for signal collection. Use ‘global’ if getting CSP errors. Default is ‘iframe’. |
Core Signal Types
Auto-Instrumentation collects different types of signals automatically:
interaction
Interaction signals emit in response to a user interaction (like clicks or form submissions)
instrumentation
Instrumentation signals emit whenever a Segment event is emitted.
navigation
Navigation signals emit whenever the URL changes.
Note: you can also rely on the initial analytics.page() call, which you can access as an Instrumentation signal.
network
Network signals emit when an HTTP Request is made, or an HTTP Response is received. To emit a network signal, the network activity must have the following requirements:
- Initiated using the
fetchAPI - First party domain (for example, if on
foo.com, thenfoo.com/api/products, but notbar.com/api/products) - Contains the content-type:
application/json
Troubleshooting
Here are the most common misconfigurations preventing signals from reaching Segment.
- Not enabling signals with the URL parameter: You must start each debug session by appending
?segment_signals_debug=trueto your URL parameters. - Running debug mode with an ad blocker: An active ad blocker prevents signals from reaching Segment. Disable your ad blocker and start a new session.
- Content Security Policies: In addition to the default Analytics.js Content Security Policies, you must add
cdn.jsdelivr.netto your allowlist, orhttps://cdn.jsdelivr.net/npm/@segment/analytics-signals@latest/dist/umd/analytics-signals.umd.jsif your policies require the full path.
Next steps
This guide walked you through initial Signals SDK/Auto-Instrumentation setup. Next, read the Auto-Instrumentation Signals Implementation Guide, which dives deeper into Signals and offers example rules.
This page was last modified: 05 Nov 2025
Need support?
Questions? Problems? Need more info? Contact Segment Support for assistance!